
, 5 min de citire
Composting monitoring software: managing your windrows online
On a composting site, monitoring windrows means taking temperatures, writing them down and deciding when to turn. With monitoring software, probes take the temperatures automatically and you check them online. This article describes how it works, from creating a campaign to exporting the data.
From logbook to screen
With manual readings, each measurement means walking to the windrow, reading a value, then entering it. Data arrives late, sometimes incomplete, and still has to be gathered before it can be analysed.
With connected probes, measurement is automatic. Each probe transmits by radio (LoRa) to a gateway, then to a server. Measurements are displayed on a web platform, from a computer or a phone. There are no more rounds to take temperatures.
Nothing to install on your computers: the platform opens in a browser. The gateway receives the data from the probes and sends it to the platform.
One campaign per phase
The software is organised into campaigns. You create a fermentation or maturation campaign, attach the windrows concerned and set your temperature targets for that phase.
This split follows the life of a windrow: building, temperature rise, turning, then maturation. A campaign groups the monitored windrows, the probes that measure them and the period covered. At the end, all the measurements for these windrows are in one place.
When the material moves to maturation, you open a new campaign, with its own targets.
Each probe to its windrow
Once the campaign is created, you assign the probes to the windrows concerned. A windrow can receive one or more probes, and each curve is then read windrow by windrow.
The probes run on battery, with no cable or power supply on the windrow. To monitor another windrow, you move the probe, then change its assignment on the platform.
The battery lasts five years at one measurement per hour, and it can be replaced.
The dashboard
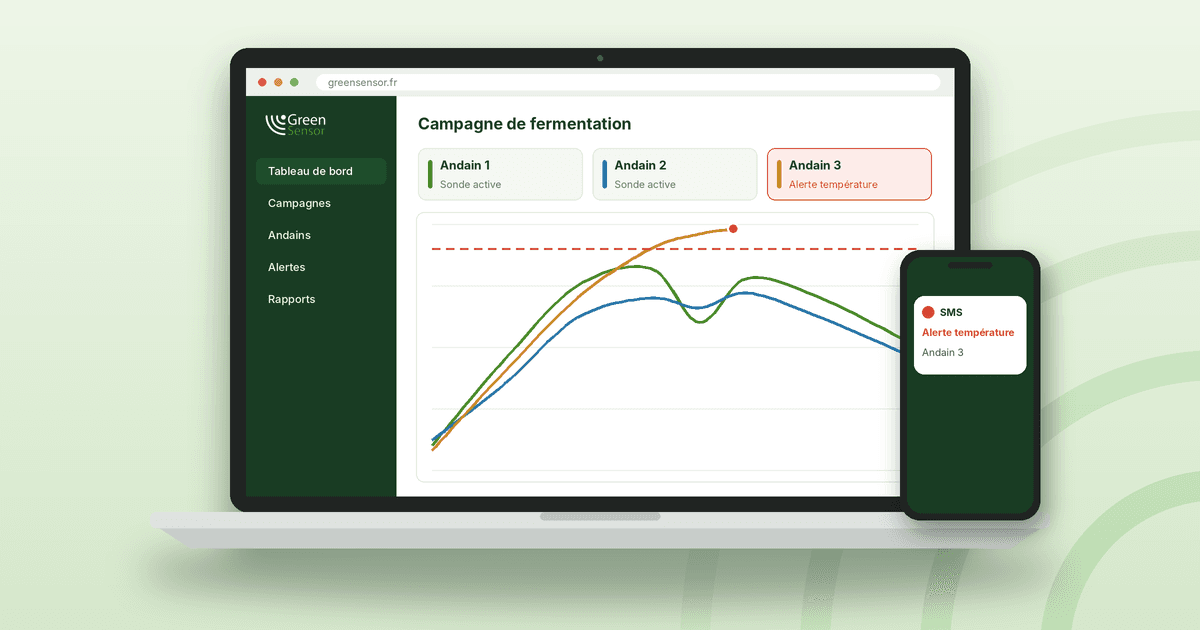
The dashboard shows the latest measurements and the history of each windrow. Two temperatures are recorded: at the core of the pile and in the air, at the housing. Comparing the two helps tell a process-related drop from a simple cold snap.
With one measurement per hour, the curve shows the temperature rise, the plateau, then the decline. It helps choose when to turn or water.
This rate gives twenty-four points per day per probe, enough to see the effect of a turn within the following hours. Comparing two windrows of the same composition also shows which one is heating less.
Alerts
Nobody watches the screen all the time. You set temperature thresholds: as soon as one is exceeded, an SMS or e-mail goes to the people you choose.
Thresholds depend on your materials and your process. Keep them few: when alerts come too often, people stop reading them.
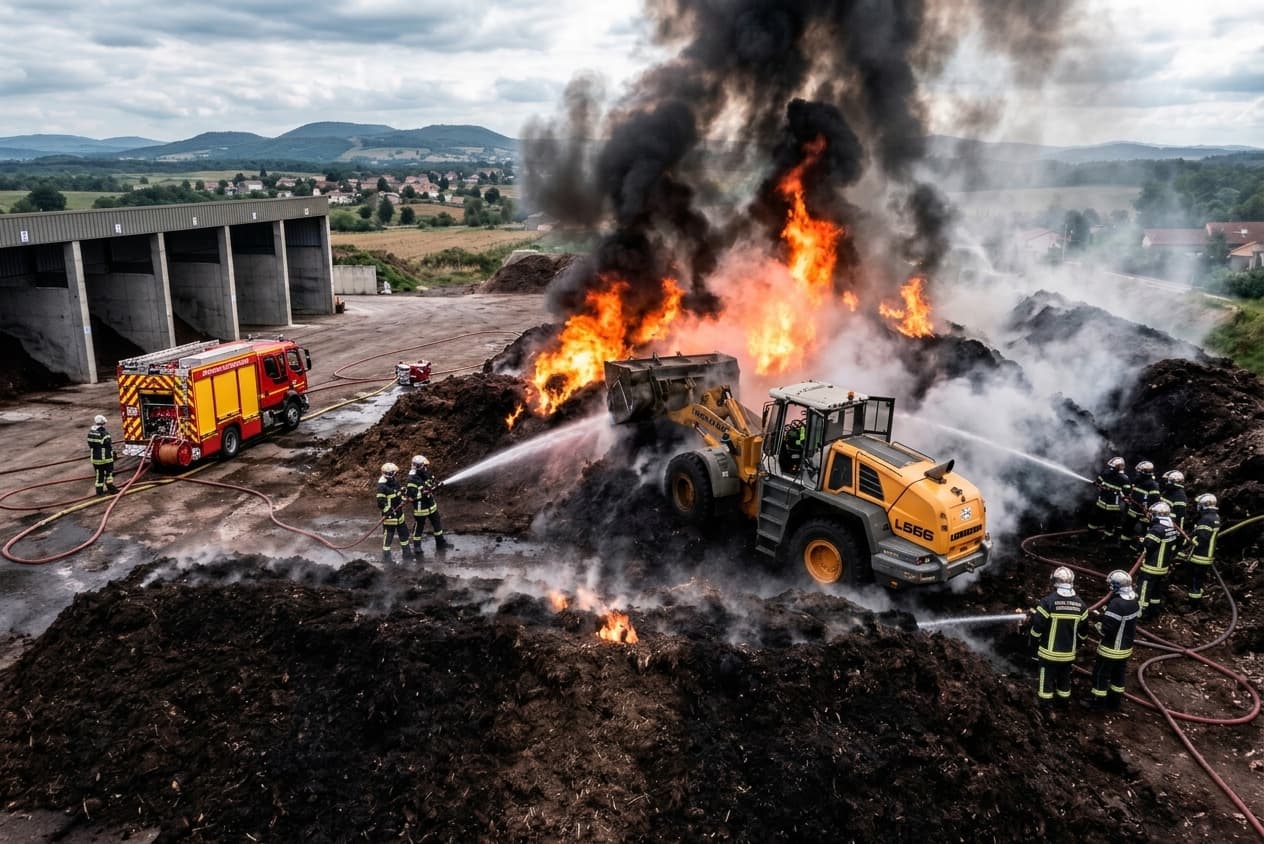
Example: on a Friday evening, a windrow that is too dry goes over its temperature threshold. Excessive heating can lead to a fire. Without an alert, the problem is found on Monday. With an alert, the team is told that evening and can water or turn the windrow.
Export and archive
Data storage is included. All measurements remain available online, with no server to manage on site. You can export them for your own analyses and print reports per campaign.
Exports also let you compare campaigns, for example by season or by type of material.
Campaign reports can be sent to your customers or shown during an inspection.
GreenSensor combines wireless probes with a web platform that includes campaigns, alerts, data storage and reports.

Un proiect de monitorizare a temperaturii?
Un consultant Prosensor vă prezintă GreenSensor și răspunde întrebărilor dvs.